As we resume the tradition of the Anchor’s The Way newsletters, we feel indebted to, and must pay a special tribute to Katrena and Harry Plumblee whose real estate licenses were active with Anchor from 1995 until their retirement in 2014. They carved out this unique concept of providing in-depth studies focused on our St. George Island market. Many St. George Island old timers may still have buried in their files some past issues of Anchor’s The Way dated from the 1990’s or 2000’s. Since their departure from the island, Katrena and Harry have enjoyed their retirement in the Atlanta area. You are welcome to reach them through Anchor or via email at harryplumblee@comcast.net.
The purpose of this newsletter is to demonstrate that our current pricing is sustainable, and that we do not anticipate a real estate price bubble any time soon. To do so, we have researched the Median sales prices of Plantation houses located beachfront on St. George Island, for every year since 2002. Consequently, our scope includes the years preceding the 2005 Bubble, the 2005 Bubble itself, the years of stalling (when no one exactly knew where the market was), the long valley of stabilization, and the recovery experienced since 2018.
 When taking a historical perspective, a factor often overlooked is inflation. One dollar in 2002 had the buying power of $1.65 of today. We have consequently adjusted the Median Sales Prices for each year to account for the compounded inflation rate until now. Since 2002, the compounded inflation rate has been 1.65. Since 2010, the factor has been 1.36. When applying inflation factors to the ‘actual’ Median price, the evolution that we see is quite different from the one witnessed when we look at the ‘actual’ numbers only. Yet, we will all agree that comparing the 2002 raw data with 2022’s is tantamount to comparing apples and oranges.
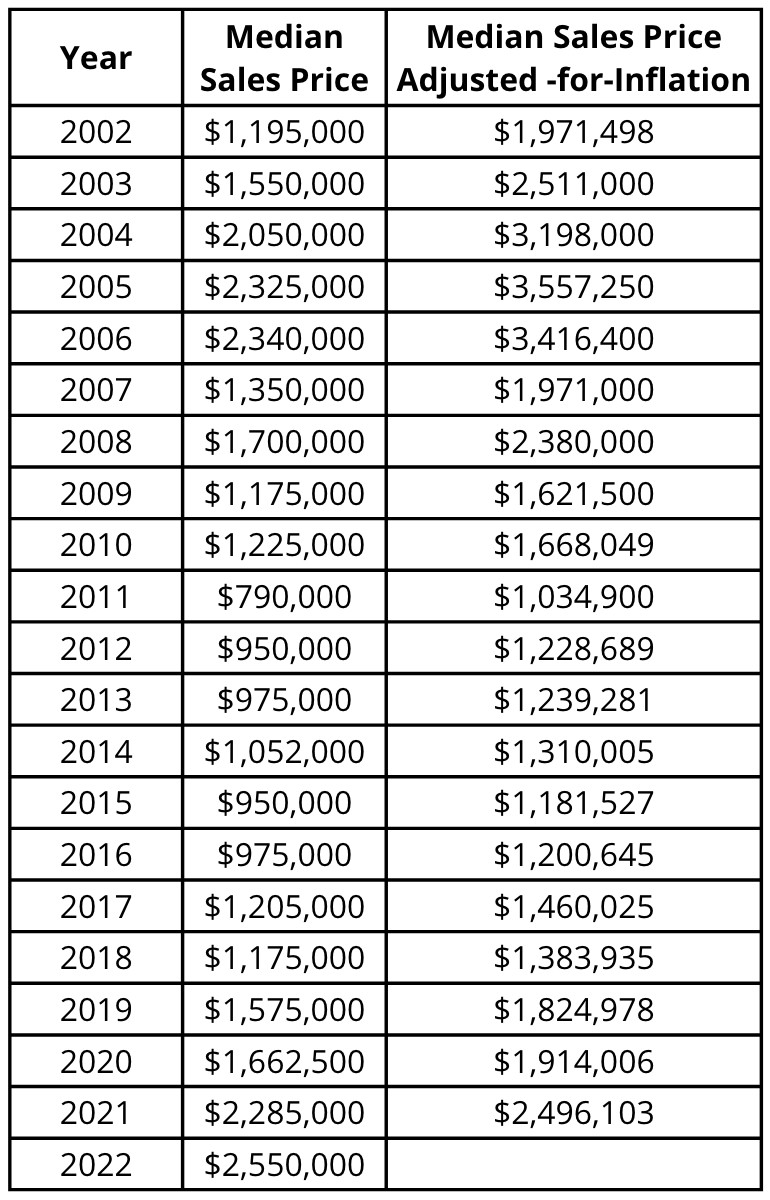
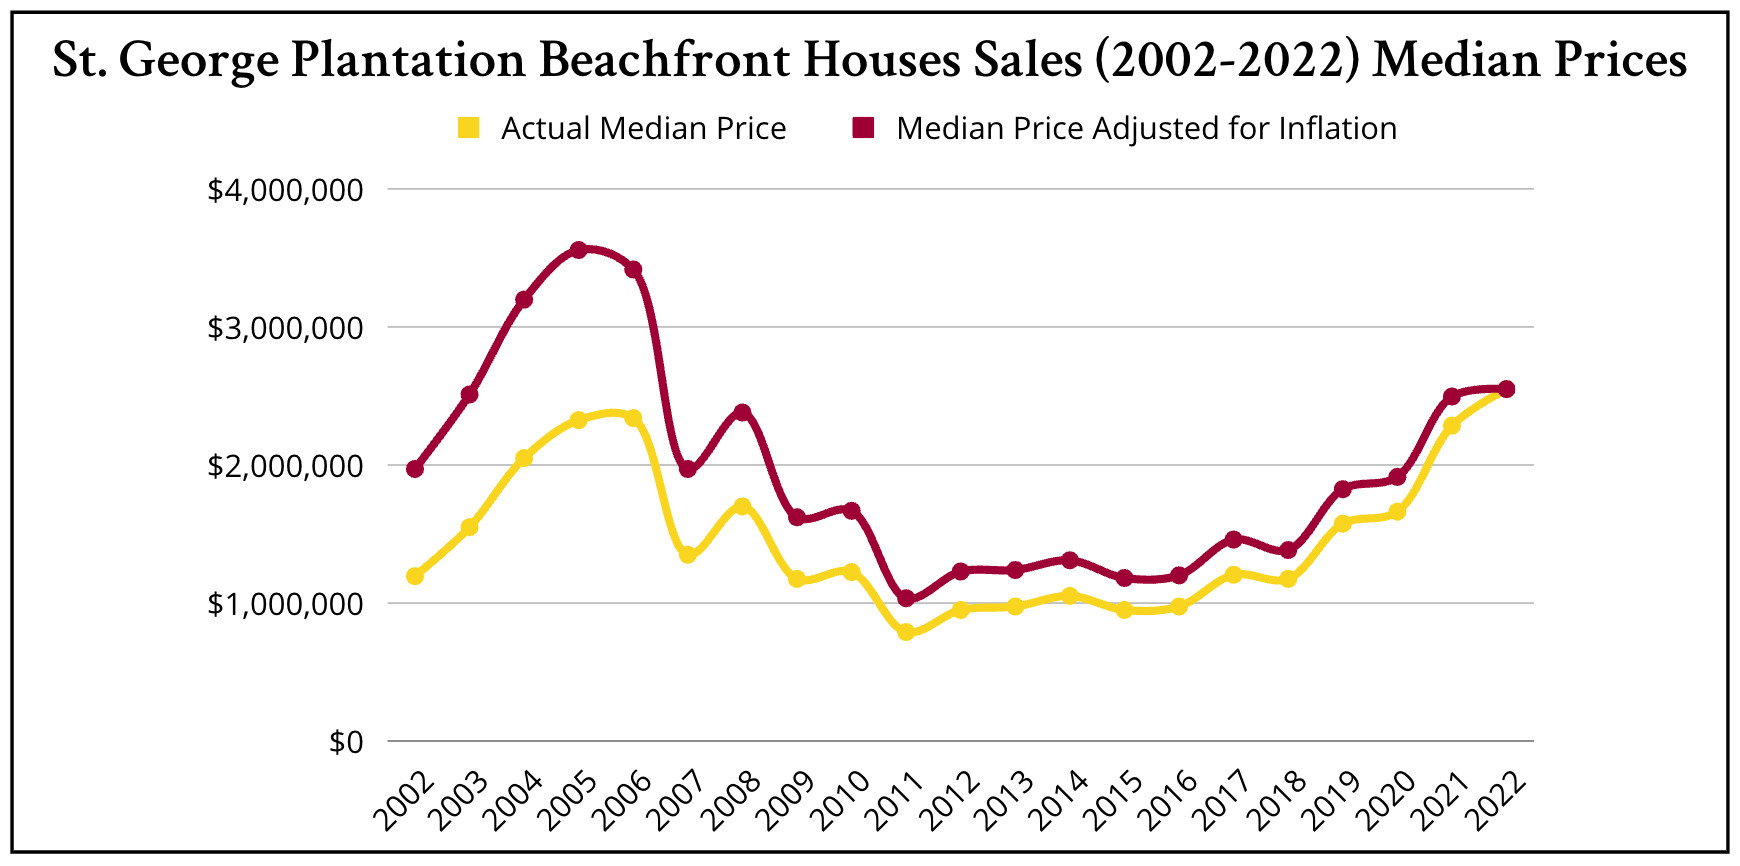
The double-entry table displays the historical data, ‘raw’ (2nd column) and ‘adjusted-for-inflation’ (3rd column), of the Median Sales Prices of beachfront homes in the St. George Island Plantation. The gold curve (on the chart below) displays the evolution of ‘raw’ values. The garnet curve visualizes what the same data looks like when adjusted for inflation.
There is no need for a long explanation to point out to the obvious:
- The gold curve (‘raw’ data) registers a pre-2005 Bubble jump from $1,195,000 in 2002 to a peak of $2,340,000 in 2006. It is followed by a stall from 2007 until 2011 when values reached the bottom at $790,000. Then, a gradual creeping upwards to reach $1,175,000 in 2018. In 2019 began a solid upwards trend with $1,575,000 that year, followed by $1,662,000 in 2020. Then, prices jumped to a Median of $2,285,000 in 2021, to reach $2,550,000 in 2022.
- The gold curve below underscores that prices in 2022 were higher than those of the 2006 peak: $2,340,000 in 2006 vs. $2,550,000 in 2022. This is almost 10% higher. The media, avid for sensational news, reasons as follows: If 2006 caused the ten-year crash that we know, how much worse off should we be now?! Beware, a new bubble is near, a crash is coming!
- The garnet curve ‘Adjusted for Inflation’ has a different appearance and tells a different story. 2002 began with a robust and stable market at $1,971,000. The bubble peaked in 2005 and 2006 with Adjusted Median Sales Prices of respectively $3,548,000 and $3,423,00. The bottom was hit in 2011 with a low of $1,035,000. Seven years later, by 2018, the prices had crept up to $1,384,000. This represented a 4% increase per year. Then, in 2019, a new stronger upward trend gained momentum, reaching $1,825,000; followed by $1,914,000 in 2020; $2,496,000 in 2021; and $2,550,000 in 2022.
- The garnet curve evidences that the 2005 peak ($3,548,000) was 39% higher than today’s pricing ($2,550,000) – when inflation is taken into consideration.
- The market stands today almost 40% below the peak of 2005 – this is roughly half-way between its bottom and its peak. One could not define a more stable and sustainable situation.
What factors should we also consider? In 2005, most buyers were (1) flippers and (2) highly leveraged. Furthermore, (3) only a small pool of investors, primarily from N. Florida, Georgia and Alabama, was involved in these buy-and-flip transactions. Since 2019, driven by the new trends of remote work and immigration from other states, the pool of buyers has become wider and stronger, originating from most of the eastern half of the United States. These buyers favor cash purchases. They also are end-users. The attention given since 2019 to NW Florida by large investment funds, such as BlackRock, has compounded the demand and improved the buyers’ solvency.
In addition to the factors outlined above pointing at the financial stability of the new buyers, the market has gradually recuperated from the abysses of the 2011-2017 era, and stabilized at a price level that we deem reasonable, even affordable considering the demand. In comparison to other Florida markets such as Tampa Bay, South Florida, and Santa Rosa Beach, we are a steal!

