The purpose of this article is to demonstrate that our current pricing is sustainable, and that we do not anticipate a real estate price bubble any time soon. To do so, we have researched the Median sales prices of houses located beachfront on 30A-West (from Blue Mountain Beach to Stallworth), for every year since 2002. Consequently, our scope includes the years preceding the 2005 Bubble, the 2005 Bubble itself, the years of stalling (when no one exactly knew where the market stood) from 2006 until 2012, the long valley of stabilization from 2012 until 2018, and the recovery experienced since 2018.
 When taking a historical perspective, a factor often overlooked is inflation. One dollar in 2002 had the purchasing power of $1.65 today. We have consequently adjusted the Median Sales Prices for each year to account for the compounded inflation rate from that year until now. Since 2002, the compounded inflation rate has been 1.65. Since 2010, the factor has been 1.36. When applying inflation factors to the ‘actual’ Median price, the evolution that we see is quite different from the one witnessed when we only look at the ‘actual’ numbers. Yet, we will all agree that comparing the 2002 raw data with 2022’s is tantamount to comparing apples and oranges.
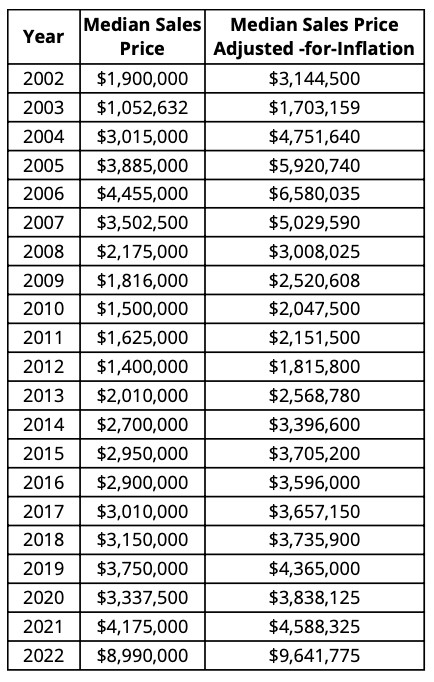
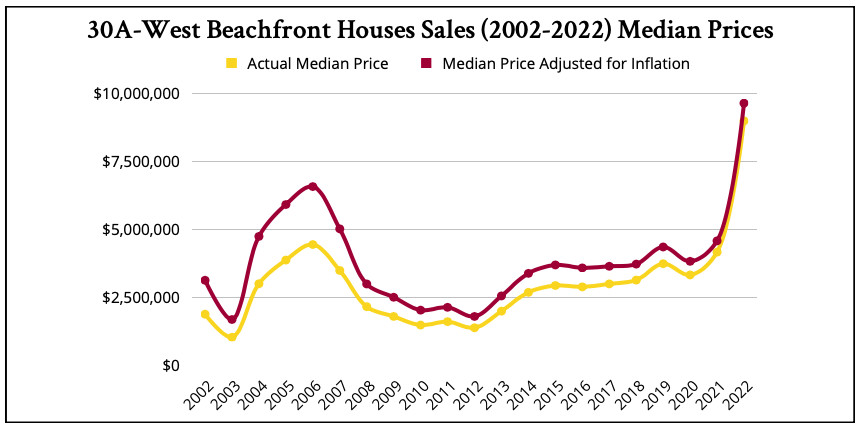
The double-entry table above displays the historical data, ‘raw’ (2nd column) and ‘adjusted-for-inflation’ (3rd column), of the Median Sales Prices of beachfront homes in 30A-West. The gold curve (on the graph below) displays the evolution of ‘raw’ values. The garnet curve visualizes what the same data looks like when adjusted for inflation.
There is no need for a long explanation to point out to the obvious:
- The gold curve (raw data) registers a pre-2005 Bubble jump from $1,900,000 in 2002 to a peak of $4,455,000 in 2006. It is followed by a stall from 2007 until 2012 when values reached the bottom at $1,400,000. Then, a gradual creeping upwards to reach $3,150,000 in 2018. In 2019 began a solid upwards trend with $3,750,000 that year, followed by $3,337,500 in 2020. Then, prices jumped to a Median of $4,175,000 in 2021, to reach $8,990,000 in 2022.
- The gold curve (raw data) below underscores that prices in 2022 were higher than those of the 2006 peak: $4,455,000 in 2006 vs. $8,990,000 in 2022. This is almost 102% higher. The media, avid for sensational news, reasons as follows: If 2006 caused the ten-year crash that we know, how much worse off should we be now?
- The garnet curve (adjusted for inflation) has a different appearance and tells a different story. 2002 began with a robust and stable market at $3,144,500. The bubble peaked in 2005 and 2006 with Adjusted Median Sales Prices of respectively $5,920,750 and $6,580,035. The bottom was hit in 2012 with a low of $1,815,000. Six years later, by 2018, the prices had crept up to $3,735,900, 19% above the 2002 level. Then, in 2019, a new stronger upward trend gained momentum, reaching $4,365,000; followed by $3,838,125 in 2020; $4,588,325 in 2021; and the much higher $9,641,775 Median in 2022 breaks vividly with the rather continuous curve of the previous years. This can be explained by the higher interest rates registered since the 2nd quarter of 2022; high mortgage rates have driven out many of the entry-level 30A buyers, thus shifting up tremendously the Median price. This is NOT a reflection of a market price increase.
- The garnet curve (adjusted for inflation) evidences that the 2005 peak ($5,920,000) was 24.2% higher than the 2021 market level ($4,488,000).
- The market reached in 2022 a record-breaking $9,651,775 level, or over 60% higher than the peak of 2005. This number would be most alarming, unless two mitigating factors are infused: (1) the quality of houses acquired in 2022 tends to surpass the quality of houses traded in previous years and (2) new palatial constructions have impacted the numbers. It is our opinion that the market is stable… Even solidified by the serious money that has now permeated the beachfront-30A market.
What factors should we also consider? In 2005, most buyers were (1) flippers and (2) highly leveraged. Furthermore, (3) the buyers of 2005 belonged to a small pool of investors, primarily from N. Florida, Georgia, and Alabama. Many purchases and sales were short-term buy-and-flip transactions. Since 2019, driven by the new trends of remote work and immigration from other states, the pool of buyers has become wider and stronger, originating from most of the eastern half of the United States – and a non-negligeable share of West Coast “expats”. These buyers favor cash purchases. They also are end-users. The attention given since 2019 to NW Florida by large investment funds, such as BlackRock, has compounded the demand and improved the buyers’ solvency.
In conclusion, the market has gradually recuperated from the abysses of the 2011-2017 era, and stabilized at a price level that we deem reasonable, even affordable considering the demand. In comparison to other Florida markets such as Tampa Bay, Naples, and South Florida, we are a steal!

