The purpose of this study is to analyze the pricing trends in Watercolor since 2002. To do so, we have gathered the Median sales prices in the subdivision for over twenty consecutive years. Then, important nuance, we have adjusted the Median prices for inflation each year: one dollar in 2002 had the buying power of $1.66 in 2022. Failing to adjust for inflation over such a long period is tantamount to comparing apples to oranges. Much of the hype heard in the past two years about a real estate bubble is linked to the misconception derived from not adjusting data for inflation.
Started in 1999 under the leadership of the St. Joe Company’s original CEO, Peter Rummell, the 499-acre parcel with 1,500 feet of Gulf-frontage morphed from forestry land to one of the jewels of Florida real estate. In those days, it was a leap of faith. The belief was that if you build it, they will come… and they (you) came! Our data begins in 2002, when the subdivision was in its infancy, but its character, infused by the exceptional land, was omnipresent.
2002 – 2006: The Beginnings.
The Adjusted-Median-Price (adjusted for inflation) grew rapidly from $1.1M in 2002, to $1.2M in 2003, $1.7M in 2004, $2.3M in 2005, and back down a bit in 2006 to $2.1M. The premium demanded in the early days was justified by the nature of the land and quality of the infrastructure. This drew a more financially stable set of original buyers.
The original growth rate was strong but did not surprise anyone at first, because the economy was prosperous, and Watercolor was… Watercolor – the best! Toward the spring of 2005, some (including the professionals at Anchor Realty Florida) expressed concerns about the sustainability of the value jumps registered in 2004 and 2005. Two consecutive years, 2004 and 2005, clocking at a 40% increase in value for each year would be difficult to maintain. Then, the music stopped in 2006, the number of transactions fell, and no one truly knew where values stood. This was the 2005/2006 bubble.
2007 – 2009: The Stall.
Stating that prices decreased does not reflect the situation faithfully. Best is to write that prices went into a stall. Nobody could point at precise values during this 1000-day stall. The data set of sold prices was haphazard.
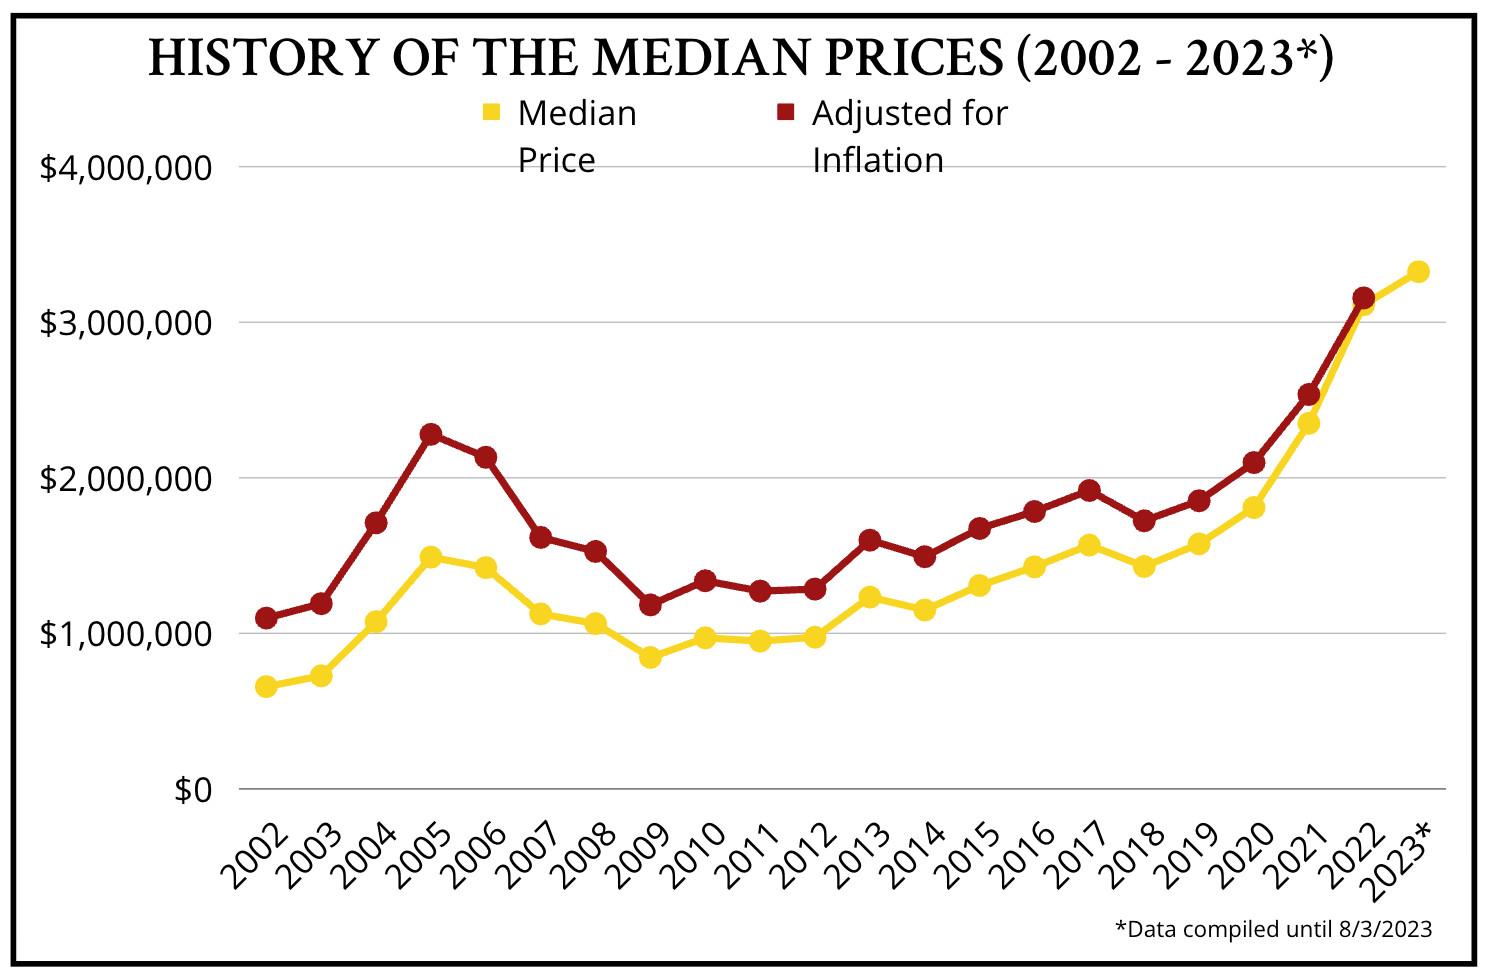
Things were getting worse, but we had no clue on how deeply we would fall: $1.6M in 2007, $1.5M in 2008, and $1.2M in 2009. In 2009, we were back to the 2003 pricing. These years prompted much soul-searching among developers and real estate professionals. As a side-note, our brokerage abandoned at that time the traditional model, heavy in brick-and-mortar (we owned then 25,000 square feet of office space), to favor a more Spartan model, focusing on online presence and data-driven professionalism.
2010 – 2012: The Crossing of the Desert.
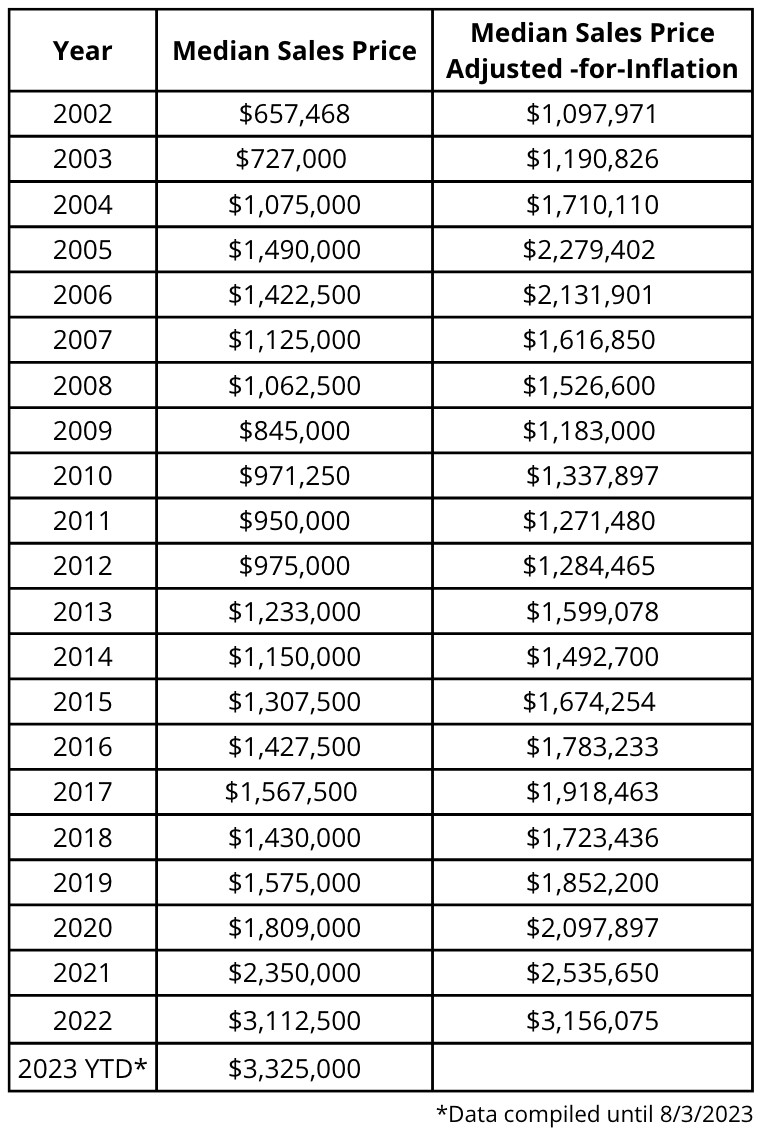 After the stall and the crash… The crossing of the desert, where prices stagnated around $1.2M/$1.3M. The years 2010, 2011, and 2013 where years of nothingness – few transactions and rock-bottom prices. It must be noted that Watercolor’s market depression was mild compared to most other markets in the Florida Panhandle. The quality of the concept and design, paired with the stunning natural setting are responsible for this performance.
2013 – 2019: A Gradual Recovery.
Here again, kudos to the St. Joe Company for monitoring the mild growth through detailed planning and quality construction. These seven years (2013 through 2019) displayed regular value increases, taking the adjusted median from $1.3M to $1.9M. It was the time, in hindsight, to buy into Watercolor! Just before Covid struck, the market seemed to have recovered its normalcy.
2020 – 2023: Maturity.
Then came Covid! The drastic change in lifestyle drove many out-of-state and wealthy buyers to our shores. Construction began booming again. Demand peaked. This created a favorable climate for a long-overdue price hike bring the adjusted median to $2.1M in 2020, $2.5M in 2021, and $3.2M in 2022. The $3.3M reached in 2023 (YTD until 8/3/2023) shows a sustainable 3% rate of appreciation in seven months, beating inflation.
Conclusion:
Watercolor’s pricing has followed the general real estate market trends in Northwest Florida… But the upscale nature of the community has paid dividends for the homeowners. Although Watercolor experienced a slow period after the peak of 2005/2006, the lowest pricing, in 2009, equaled more than half of the peak values. Even though this may seem drastic, this is a sign of stability in an environment where some communities traded at an 80% discount over the same timeframe.
The St. Joe Company, through a fine balance between vision and planning, has created with Watercolor a life-style destination and a superb investment vector, as recession-proof as can be hoped for in the NW Florida real estate world. To quote Voltaire, “Everything is for the best in the best of all possible worlds!”
