“I have sold in 27 different complexes in Panama City Beach since Hurricane Michael, but Laketown Wharf, Shores of Panama, and the Summit have my heart! They have been a staple for me in my career. Between the three buildings, I have sold seven different units this year with another listing that went on the market 2 days before press time. Thank you for your business!” – Dale Gumm
We know that Covid has changed our real estate market. We know that many new residents have moved to PCB from other states since 2020. We also have felt the pinch caused by increased mortgage rates. A lot of contradictory opinions are circulating, from the imminence of a crash to a slowing market. From this hodge podge of news, what to believe? To answer, we shall look at data and analyze what has happened… and the underlying trend that is now developing is most interesting.
Sales Volumes
The tables below show recent market-data specific to Laketown Wharf, Shores of Panama, and the Summit. For each complex and for each month since January of 2020, we have noted the number of closings. We also show the results for each quarter since the first quarter of 2020 (2020-Q1), aggregating the three months of January, February, and March 2020. The monthly data is coded with a background color to indicate in blue the times of euphoria, in red the times of depression, and in grey the more normal times. You will see that, although a given month does not necessarily show the same colors for all three complexes, the patterns are resembling.
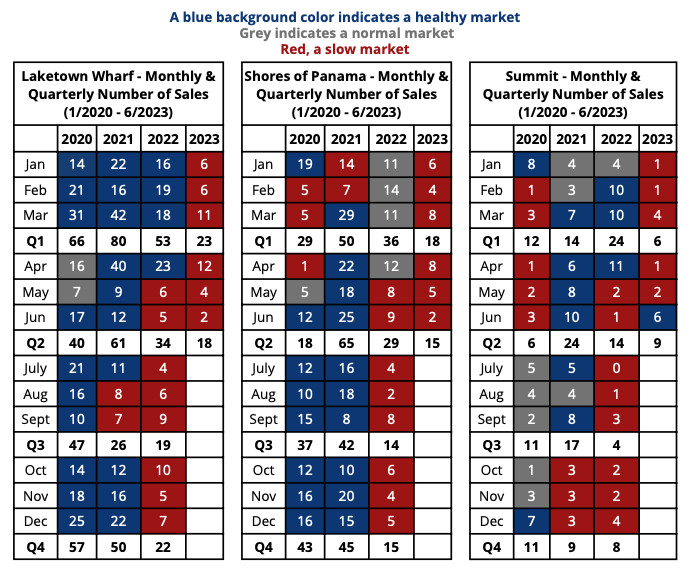 We see that the closings went gangbuster in June of 2020, indicating an active market that started as early as April 2020 and lasted for sixteen months. The first signs of slowing down in the market were felt in August 2021. Then, the sales volume dropped significantly in May of 2022, indicating that March 2022 was the last month when buyers were signing contracts. Consequently, we can look at the period of time comprised between April 2020 and March 2022 as the golden consequence of Covid: 24 months of euphoria. From May 2022 until May 2023, the number of contracts closed was half (or less than half) of the number written before that month. This bad news was caused in part by the increase in interest rates causing sellers not to sell (because they could not afford a replacement property with higher mortgage rates) and the buyers not to buy (because they could no longer afford what they wanted, due to higher interest rates).
Visualizing an Improving Situation
We dug deeper into the data available in the three tables previously studied, and decided to look at the evolution over time of the variation in sales data from one quarter to the same quarter on the previous year. For example, how did January – February – March 2023 compare with January – February – March 2022? Or, to put in a more formal fashion: 2023-Q1 / 2022-Q1.
A ratio of 1 (Index = 100) means that the same number of sales happened during a quarter and the same quarter the following year. If the ratio is less than 1 (Index between 1 and 99), then the market shrunk; if we show an Index 50, it simply means that the number of sales was cut in half from one year to the next. If the ratio is more than one, the Index higher than 101, the number of transactions is growing; if the Index is 120, the number of sales increased by 20%.
The second quarter of 2020 brought 64 sales. The second quarter 2021, 150. 150/64 = 2.34, or Index 234. Sales more than doubled from Q2-2020 and Q2-2021. This reflects the phenomenal increase in activity brought by the end of Covid’s restrictions in Florida: a 134% increase in activity!
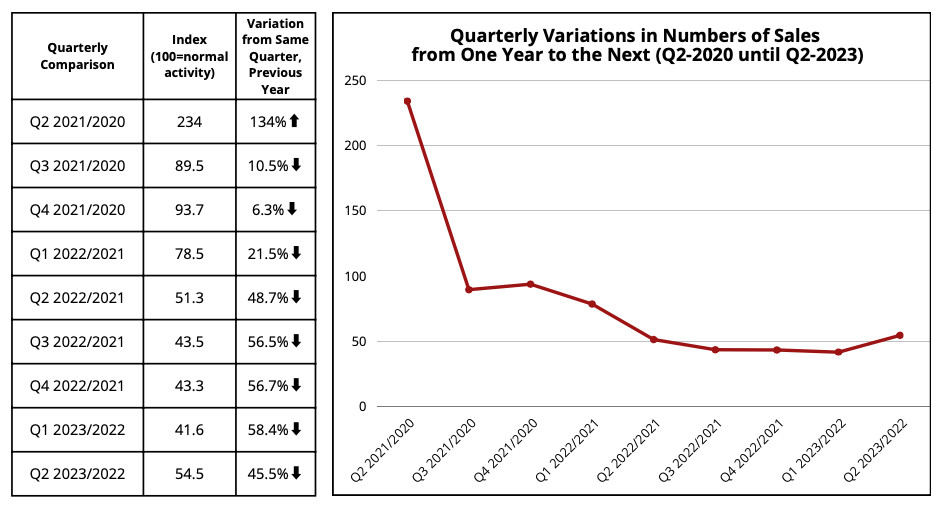
The third quarter of 2020 yielded 95 sales. Q3-2021, 85. 85/95 = 0.895, or Index 89.5. This points at a 10.5% decrease in activity, a noticeable yet small decrease.
Table 2 and Graph 2 above visualize the trend in sales activity: a stellar second quarter 2021 (234), then honorable third and fourth quarters 2021 (89.5 and 93.7), followed by a less honorable first quarter 2022 (78.5), and the subsequent abysses of the second, third, and fourth quarters 2022, and of the first quarter 2023 (51.3, 43.5, 43.3, 41.6)… But look at the second quarter 2023 that just ended June 30, 2023: at 54.6 the curve is moving back up by 31%, leaving tangible hope for regained activity during the second half of 2023.
In summary, Covid has brought in large numbers of new buyers who were (1) reasonably leveraged and (2) new residents of the State of Florida. This influx took place mainly between June 2020 and April 2022. These days of euphoria were followed by a drastic market contraction, caused greatly by higher interest rates and attrition of supply. The graphs in this newsletter speak volumes. Yet, no relevant conclusion could be brought forth without a careful analysis of the pricing and dynamics of the pricing evolution. This is what we shall study for our next issue of Anchor’s The Way… Stay tuned.

