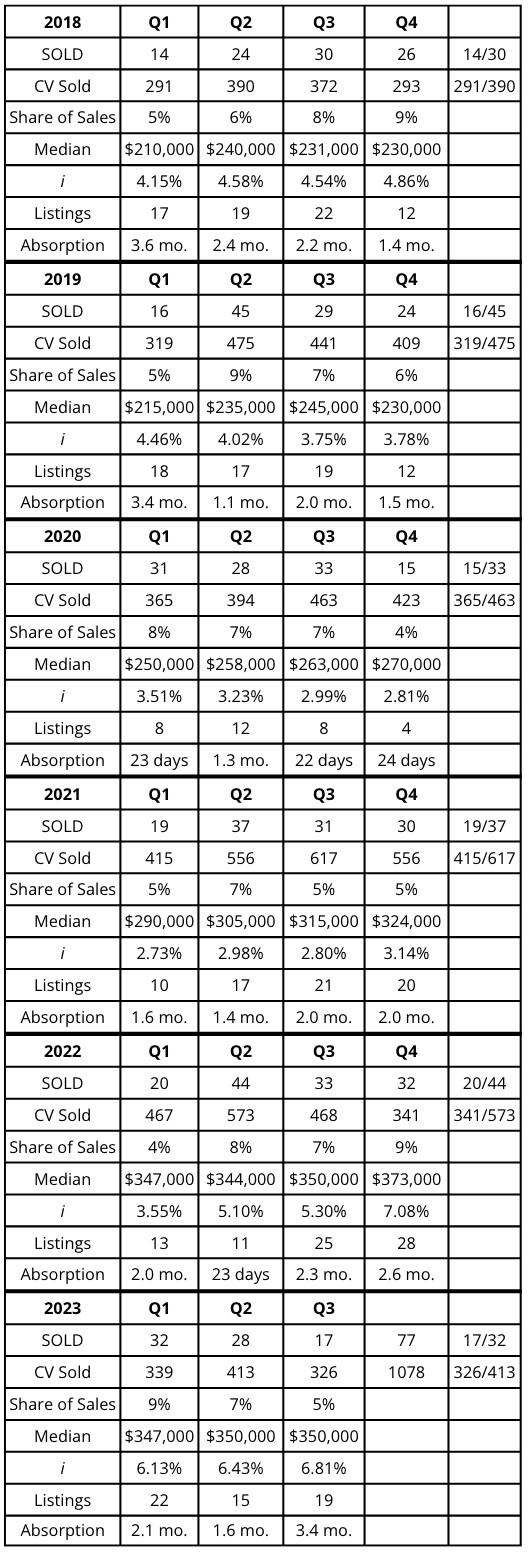
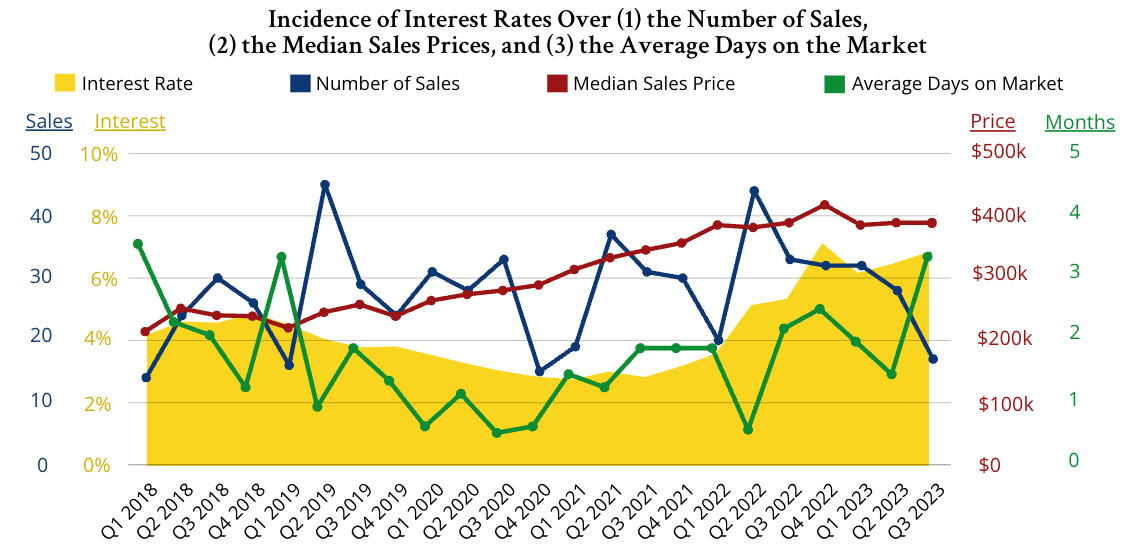
The objective of this article is to attempt to correlate interest rates with some key performance indicators of the market. In other words, how do interest rates impact values, sales activity, and inventory? This approach has been dictated by an ever-increasing number of alarming news feeds whereby the rise in interest rates is the recipe for a real estate crisis. As a preamble, let’s look at key market indicators since the first quarter of 2018 (2018-Q1) and try to draw some conclusions – unrelated to the interest rates.
 Activity Peaks During the Second Quarters
The number of sales tends to be highest during the second quarter of each year. This was especially obvious in 2019, in 2022 and, to a lesser extent, in 2021. Assuming that 45 to 60 days lapse between a seller and a buyer signing a contract-for-sale-and-purchase, and assuming that properties priced well go under contract 30 days after they are listed; we can safely conclude that the ‘closing rush’ of the second quarter benefits listings in place (and preferably ‘new’ listings) during the first quarter. Consequently, sellers should list in January or February to maximize their chances to sell their houses quickly.
Prices Jump During the First Half of the Year
Our table and graph is evidence that prices tend to ‘jump up’ during the first half of the calendar year to remain rather stable during the second half. This holds true for all the years between 2018 and 2022. We should remark that the thrust occurred during the second quarters in 2018 and 2019, and since 2020, happens earlier during the first quarters. Notable exception: the 2023 jump took place during the 4th quarter of 2022 and not during the first half of 2023. It is the author’s opinion that this early increase was more of a statistical fluke than the birth of a new trend. It was likely caused by the extremely low inventory of 2022-Q4. This too should encourage sellers to list early in the calendar year (or late in the year), factoring in a reasonable anticipated appreciation rate. But what ought this rate be? The answer is explained below.
Prices Increase Steadily by an Average of 9.75% per Year
The Median prices have gradually increased from $210,000 at the onset of our study-period in 2018-Q1 to $350,000 at the end of our study in 2023-Q3. This represents a 66.7% increase over a five-year and nine-month period. Annualized, this represents a yearly increase of 9.75%. It compares advantageously to the 4.14% yearly rate of inflation during the studied period. In other words, since 2018, your house should have appreciated by 5.5% per year after inflation has been deducted! You have made a great investment that happens to be a shelter against inflation. Practically, based on what has happened in the past six years, listing in December or January for a price just over ten percent above the sold values for the 3rd quarter should ensure that you sell and do not leave any money on the table.
All the remarks above do not consider the variations in interest rates. They seem to hold true regardless of the interest rates. We shall now venture into the much discussed, but little explained correlation between the interest rates and the market’s health.
Interest Rates, Data and Perception
Interest rates were stable around 3% until 2022-Q1. Then, in 2022-Q2, they jumped past 5%. They passed the 6% mark in 2022-Q3. Many deem 6% to be an important psychological threshold. Rates have remained north of 6% ever since, fluctuating between the high 6’s and the low 7’s where they now are.
What Happens When Rates Pass the 6% Threshold?
When you listen to the media, doomsday comes when rates are higher than 6%. Let’s look at the data in our neighborhood. Rates passed the infamous border between the second and third quarters of 2022. Let’s now look at the third quarters’ numbers of sales. From 2018 through 2022, quarterly sales in our neighborhood were: 30, 29, 33, 31, 32. These numbers are very stable and average 31 sales for the quarter. Then, in 2023, the number of sales dropped drastically to 17 – a 45% decrease. In short, nothing different happened in 2022-Q3, but sales were down by 45% the following year.
For the fourth quarter, the 2022 numbers show consistency and strength. Consistency because the average of previous years was 24 sales and the 32 sales in 2022 represent an increase of 33%, a sign of strength. Looking at what happened in the first quarter of the year: Before the interest rates’ increase, sales were stable again, except for the Covid-induced boom of 2020: 14, 16, 31 (2020), 19, 20, averaging 17 if not incorporating 2020. In 2023, amid high interest rates, they scored their busiest number, 32 – an 88% increase. One is tempted to conclude that high interest rates had a positive effect on the sales activity.
The second quarter of 2023 marked a return to the low end of a normal market. With 28 sales, it mirrored 2020 and exceeded the 24 sales of 2018… but scored far below the 44 sales of 2022, the 37 of 2021, and the 45 of 2019. The second quarter is historically inconsistent, but we landed in 2023 at the bottom of the normal range.
In summary, interest rates passed the 6% bar at the end of 2022-Q2. The subsequent quarters showed stability at first (2022-Q3), then strong increases in sales volume (2022-Q4/+33%), (2023-Q1/+88%) before reverting to a lower number (2023-Q2) to finally plunge in 2023-Q3 to a 45% decrease from the norm.
In conclusion, if interest rates had a direct impact on sales, the effect would have been immediate. The market continued for a full year before the dance slowed down. Consequently, we must look elsewhere for a culprit. The second quarter is historically inconsistent, but we landed in 2023 at the bottom of the normal range.
The Real Culprit: Economic Malaise
If not interest rates, what could be the cause of the drastic slowdown that has been witnessed in the past few months? Absorption rates have shown little to no connections to the overall activity. This absence of connection holds true whether the absorption time reached the all-time low of 22 days in 2020-Q3 or oscillated around the norm of 2 months. Prices too have displayed a consistent and sustainable increase. Nothing out of the ordinary there either.
The real culprit seems to be the public’s perception of the economy and the risks associated with an uncertain future. When tomorrow is questionable, sellers don’t sell, and buyers don’t buy. This situation leads to an absence of activity where only must-sell and must-buy clients are still in the market.
